


26-week pivotal Phase 3 trial with open-label extension1
Study design of the pivotal Phase 3 trial2
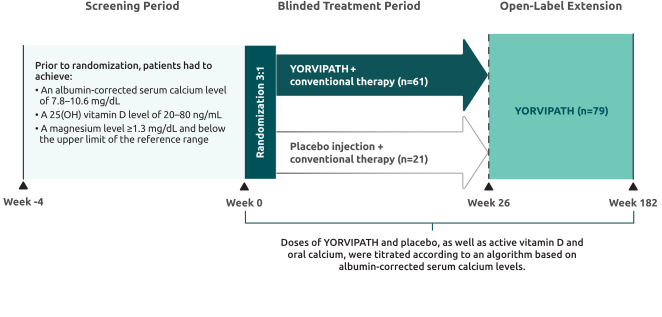
Zoom in to see details
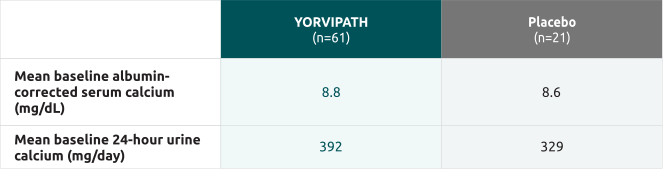
Baseline patient characteristics1,2
Pooled baseline characteristics1,2
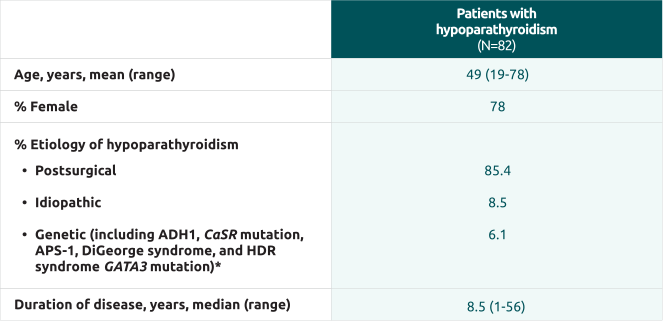
Daily doses of conventional therapy at baseline (mean)2
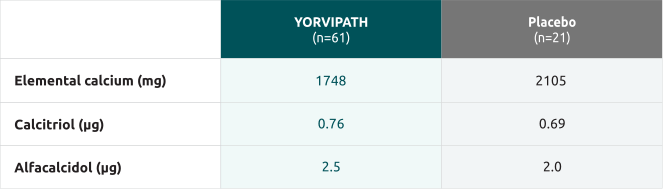
Mean baseline calcium levels2
*
Of the patients with nonsurgical hypoparathyroidism, two had autoimmune polyglandular syndrome type 1 (APS-1), one had autosomal dominant hypocalcemia type 1 (ADH1, CaSR mutation), one had DiGeorge syndrome, and one had hypoparathyroidism, sensorineural deafness, and renal dysplasia (HDR) syndrome (GATA3 mutation).1

68.9% of patients met all efficacy assessment criteria with YORVIPATH1
The efficacy assessment was the proportion of patients who achieved ALL of the following at Week 261:

Albumin-corrected serum calcium levels in the normal range (8.3 to 10.6 mg/dL)
Independence from conventional therapy (defined as requiring no active vitamin D and ≤600 mg/day of calcium supplementation,† including no use of PRN doses) since Week 22
No increase in study drug dose since Week 22
No missing active vitamin D and calcium data since Week 22
Dose of study drug ≤30 mcg/day during the entire 26-week treatment period‡
Albumin-corrected serum calcium = calcium level adjusted for albumin; used for assessment of calcium status.
†
Elemental calcium ≤600 mg/day was allowed if needed to meet recommended dietary calcium intake.1,2
‡
The study drug dose was allowed to be titrated above 30 mcg/day in the Phase 3 clinical trial, but the maximum recommended daily dose of YORVIPATH is 30 mcg/day. In the trial, patients who received a YORVIPATH dose >30 mcg/day at any time point during the 26‑week treatment period were considered nonresponders for the efficacy assessment.1,2
Percent of patients achieving efficacy assessment at Week 261
68.9%
(42 out of 61)
of YORVIPATH-treated patients achieved the efficacy assessment1
4.8%
(1 out of 21)
of patients who received placebo (treatment difference, 64.2%; 95% CI, 49.5% to 78.8%)1
Efficacy results for the individual components at Week 261
Normal Albumin-Corrected Serum Calcium (8.3 to 10.6 mg/dL)1
Patients
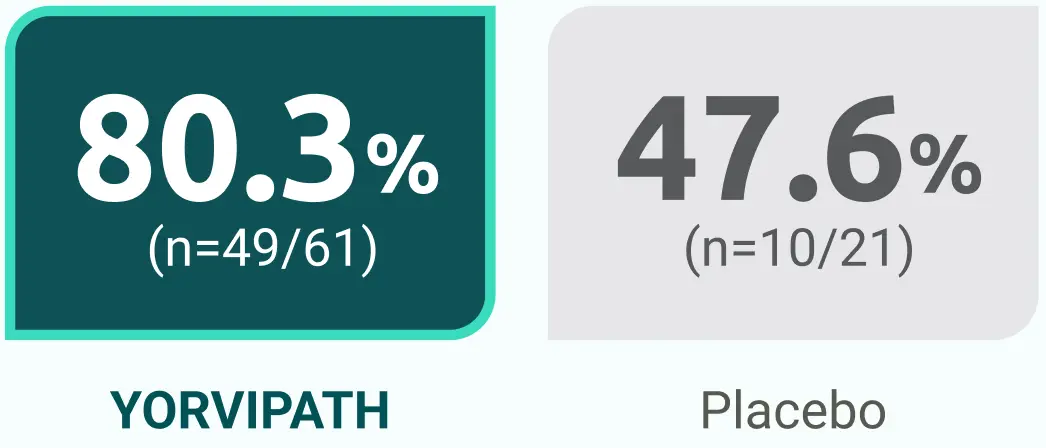
(95% CI, 9.2% to 56.3%)
Independence From Active Vitamin D1§
Patients
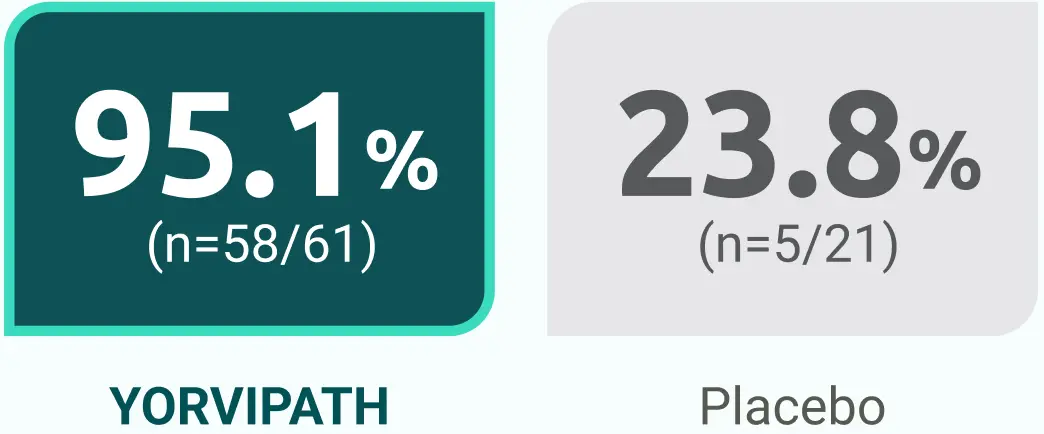
(95% CI, 52.5% to 90.2%)
Independence From Therapeutic Dose of Calcium1¶
Patients
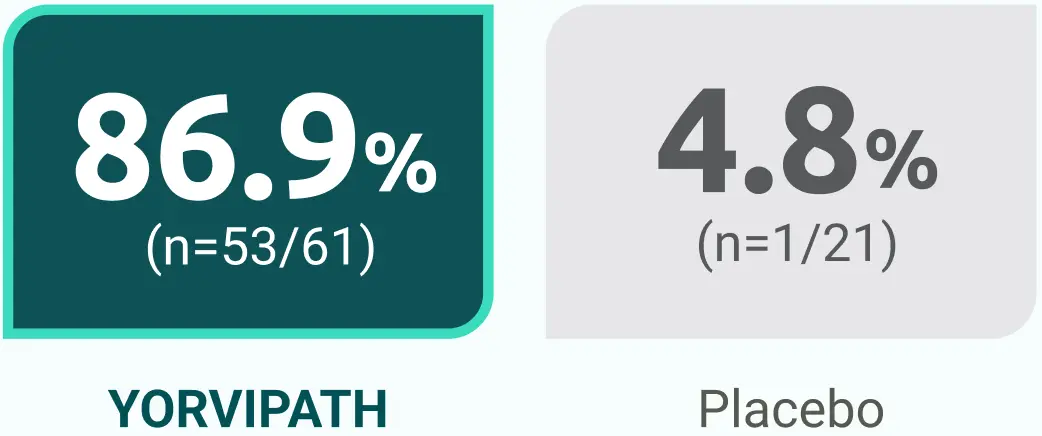
(95% CI, 70.0% to 94.4%)
No Increase in Study Drug Dose Since Week 221
Patients
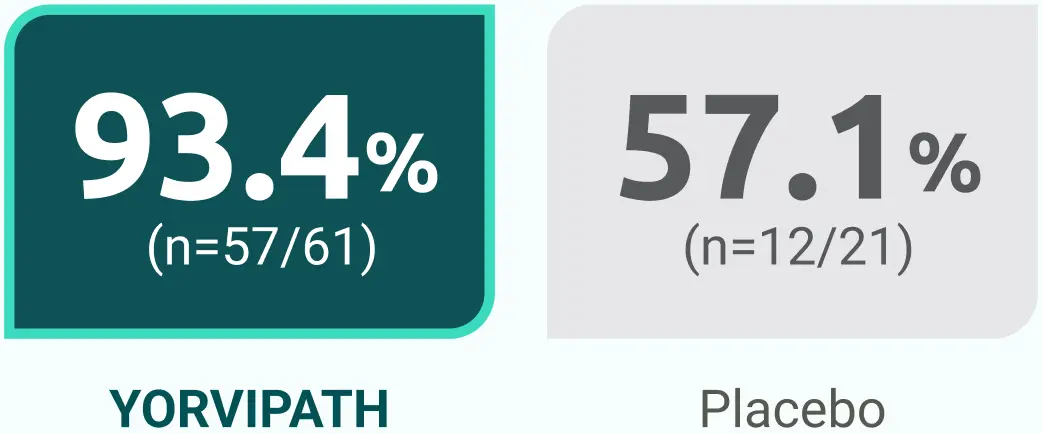
(95% CI, 14.2% to 58.5%)
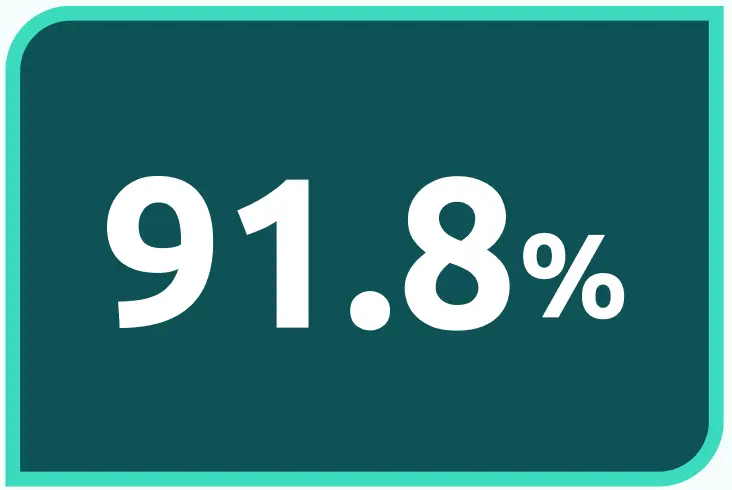
of YORVIPATH-treated patients had a YORVIPATH dose of ≤30 mcg/day during the entire 26-week treatment period1
§
No daily standing doses, no PRN doses, and no missing data since Week 22.1
¶
Average daily standing dose of elemental calcium ≤600 mg, no PRN doses, and no missing data since Week 22.1

Dr. Mark Warren, Associate Professor, Campbell University School of Medicine
Director of Clinical Trials and Laboratory Services, Physicians East, PA
Patients maintained normal serum calcium and independence from conventional therapy but required up-titration over 78 weeks1
Adjusting the dose of YORVIPATH allowed

of patients to maintain normal serum calcium and independence from conventional therapy over 78 weeks1
Not allowing for titration after Week 22, 39.3% (n=24/61) of patients met all 5 efficacy assessment criteria at Week 781
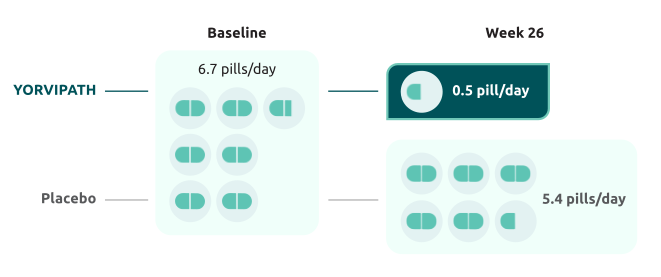
Change in mean daily active vitamin D and calcium pill burden from baseline to Week 262
Zoom in to see details
At Week 26, the YORVIPATH group went from 6.7 pills/day of active vitamin D and calcium to 0.5 pill/day, compared to 5.4 for the placebo group.2
All patients, including those with YORVIPATH doses >30 mcg/day at any point during the treatment period, were included in this analysis.2

“I am so thankful that my doctor and I came to this decision to start me on YORVIPATH.”
– Joanna, a real YORVIPATH patient
Observed renal data at Weeks 26 and 523
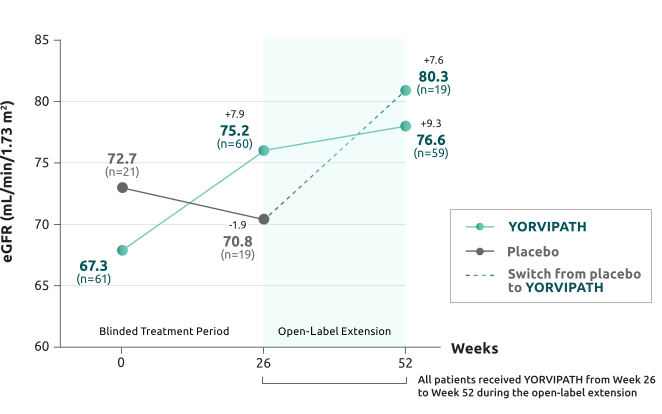
Mean eGFR at Baseline, Week 26, and Week 52
Zoom in to see details
Patients receiving YORVIPATH experienced a mean change from baseline in eGFR (mL/min/1.73 m2) of +7.9 at Week 26 and +9.3 at Week 52.
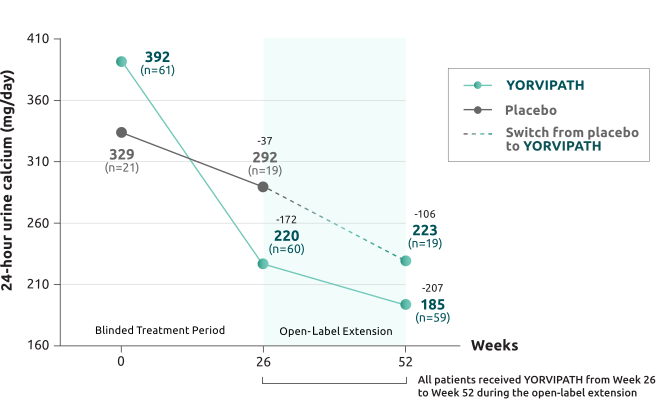
Mean 24-hour Urine Calcium at Baseline, Week 26, and Week 52
Zoom in to see details
Patients receiving YORVIPATH experienced a mean change from baseline in 24-hour urine calcium (mg/day) of -172 at Week 26 and -207 at Week 52.
Limitations: In the blinded study, because mean 24-hour urine calcium excretion was not adjusted for hierarchy, and both YORVIPATH and placebo arms had a decrease in conventional therapy doses, these findings could represent chance findings and require cautious interpretation. The treatment difference between YORVIPATH and placebo arms was primarily driven by data from participants with 24-hour urine calcium excretion of >300 mg/day at baseline. In the open-label extension study, because all participants and investigators were aware of treatment assignment after the 26-week blinded period and there was no concurrent control group during the extension period, the results should be interpreted with caution. Observed outcomes may be influenced by patient selection, attrition, and other factors unrelated to treatment.
This analysis included patients with YORVIPATH doses >30 mcg/day at any point during the treatment period.2,4


